promscale 是一个开源的可观察性后端,用于由 SQL 提供支持的指标和跟踪。
它建立在 PostgreSQL 和 TimescaleDB 的强大和高性能基础之上。它通过 OpenTelemetry Collector 原生支持 Prometheus 指标和 OpenTelemetry 跟踪以及许多其他格式,如 StatsD、Jaeger 和 Zipkin,并且100% 兼容 PromQL[1]。其完整的 SQL 功能使开发人员能够关联指标、跟踪和业务数据,从而获得新的有价值的见解,当数据在不同系统中孤立时是不可能的。它很容易与 Grafana 和 Jaeger 集成,以可视化指标和跟踪。
它建立在 PostgreSQL 和 TimescaleDB 之上,继承了坚如磐石的可靠性、高达 90% 的本机压缩、连续聚合以及在全球数百万个实例上运行的系统的操作成熟度。
Promscale 可以用作 Grafana[2]和PromLens[3]等可视化工具的 Prometheus 数据源。
Promscale 包括两个组件:
Promscale 连接器:一种无状态服务,为可观察性数据提供摄取接口,处理该数据并将其存储在 TimescaleDB 中。它还提供了一个使用 PromQL 查询数据的接口。Promscale 连接器自动设置 TimescaleDB 中的数据结构以存储数据并在需要升级到新版本的 Promscale 时处理这些数据结构中的更改。
TimescaleDB:存储所有可观察性数据的基于 Postgres 的数据库。它提供了用于查询数据的完整 SQL 接口以及分析函数、列压缩和连续聚合等高级功能。TimescaleDB 提供了很大的灵活性来存储业务和其他类型的数据,然后你可以使用这些数据与可观察性数据相关联。
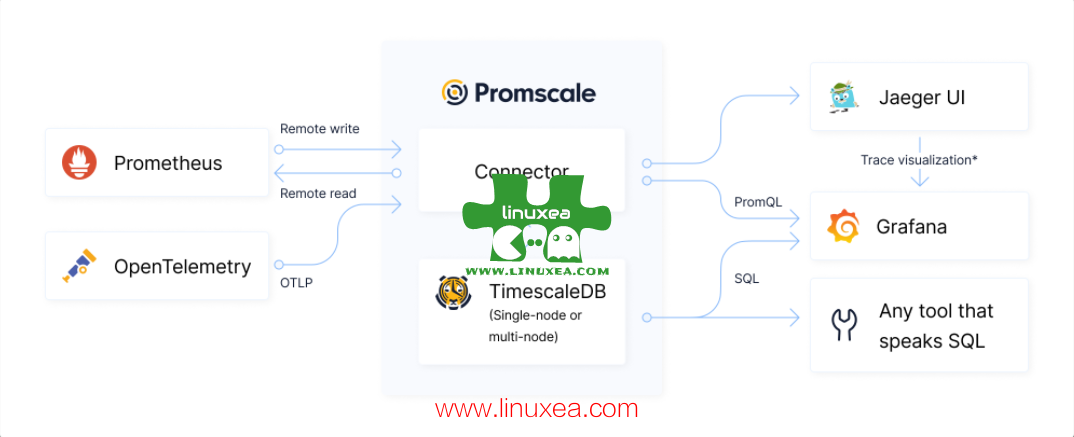
Promscale 连接器使用 Prometheusremote_write接口摄取 Prometheus 指标、元数据和 OpenMetrics 示例。它还使用 OpenTelemetry 协议 (OTLP) 摄取 OpenTelemetry 跟踪。它还可以使用 OpenTelemetry 收集器以其他格式摄取指标和跟踪,以通过 Prometheusremote_write接口和 OpenTelemetry 协议处理和发送它们。例如,你可以使用 OpenTelemetry Collector 将 Jaeger 跟踪和 StatsD 指标摄取到 Promscale。
对于 Prometheus 指标,Promscale 连接器公开 Prometheus API 端点,用于运行 PromQL 查询和读取元数据。这允许你将支持 Prometheus API 的工具(例如 Grafana)直接连接到 Promscale 进行查询。也可以向 Prometheus 发送查询,并让 Prometheus 使用接口上的 Promscale 连接器从 Promscale 读取数据 remote_read。
你还可以使用 SQL 在 Promscale 中查询指标和跟踪,这允许你使用与 PostgreSQL 集成的许多不同的可视化工具。例如,Grafana 支持通过 PostgreSQL 数据源使用开箱即用的 SQL 查询 Promscale 中的数据
我准备通过容器的方式进行尝试,我们先安装 docker 和 docker-compose
yum install -y yum-utils \
  device-mapper-persistent-data \
  lvm2
 yum-config-manager \
    --add-repo \
    https://mirrors.tuna.tsinghua.edu.cn/docker-ce/linux/centos/docker-ce.repo
yum install docker-ce docker-ce-cli containerd.io docker-compose -y
编排
我按照官网的 docker 配置,进行编排了 compose 进行测试
version: '2.2'
services:
  timescaledb:
    image: timescaledev/promscale-extension:latest-ts2-pg13
    container_name: timescaledb
    restart: always
    hostname: "timescaledb"
    network_mode: "host"
    environment:
      - csynchronous_commit=off
      - POSTGRES_PASSWORD=123
    volumes:
      - /etc/localtime:/etc/localtime:ro
      - /data/prom/timescaledb/data:/var/lib/postgresql/data:rw
    mem_limit: 512m
    user: root
    stop_grace_period: 1m
  promscale:
    image: timescale/promscale:0.10
    container_name: promscale
    restart: always
    hostname: "promscale"
    network_mode: "host"
    environment:
      - PROMSCALE_DB_PASSWORD=123
      - PROMSCALE_DB_PORT=5432
      - PROMSCALE_DB_NAME=postgres
      - PROMSCALE_DB_HOST=127.0.0.1
      - PROMSCALE_DB_SSL_MODE=allow
    volumes:
      - /etc/localtime:/etc/localtime:ro
   #   - /data/prom/postgresql/data:/var/lib/postgresql/data:rw
    mem_limit: 512m
    user: root
    stop_grace_period: 1m
  grafana:
    image: grafana/grafana:8.3.7
    container_name: grafana
    restart: always
    hostname: "grafana"
    network_mode: "host"
    #environment:
    #  - GF_INSTALL_PLUGINS="grafana-clock-panel,grafana-simple-json-datasource"
    volumes:
      - /etc/localtime:/etc/localtime:ro
      - /data/grafana/plugins:/var/lib/grafana/plugins
    mem_limit: 512m
    user: root

  prometheus:
    image: prom/prometheus:v2.33.4
    container_name: prometheus
    restart: always
    hostname: "prometheus"
    network_mode: "host"
    #environment:
    volumes:
    - /etc/localtime:/etc/localtime:ro
    - /data/prom/prometheus/data:/prometheus:rw  # NOTE: chown 65534:65534 /data/prometheus/
    - /data/prom/prometheus/prometheus.yml:/etc/prometheus/prometheus.yml
    - /data/prom/prometheus/alert:/etc/prometheus/alert
    #- /data/prom/prometheus/ssl:/etc/prometheus/ssl
    command:
      - '--config.file=/etc/prometheus/prometheus.yml'
      - '--storage.tsdb.path=/prometheus'
      - '--storage.tsdb.retention=45d'
      - '--web.console.libraries=/etc/prometheus/console_libraries'
      - '--web.console.templates=/etc/prometheus/consoles'
      - '--web.enable-lifecycle'
      - '--web.enable-admin-api'
    mem_limit: 512m
    user: root
    stop_grace_period: 1m
  node_exporter:
    image: prom/node-exporter:v1.3.1
    container_name: node_exporter
    user: root
    privileged: true
    network_mode: "host"
    volumes:
      - /proc:/host/proc:ro
      - /sys:/host/sys:ro
      - /:/rootfs:ro
    command:
      - '--path.procfs=/host/proc'
      - '--path.sysfs=/host/sys'
      - '--collector.filesystem.ignored-mount-points=^/(sys|proc|dev|host|etc)($$|/)'
    restart: unless-stopped
grafana
我们这里使用的 root 用户就是因为需要手动安装下插件
bash-5.1# grafana-cli plugins install  grafana-clock-panel
✔ Downloaded grafana-clock-panel v1.3.0 zip successfully

Please restart Grafana after installing plugins. Refer to Grafana documentation for instructions if necessary.

bash-5.1# grafana-cli plugins install grafana-simple-json-datasource
✔ Downloaded grafana-simple-json-datasource v1.4.2 zip successfully

Please restart Grafana after installing plugins. Refer to Grafana documentation for instructions if necessary.
配置 grafana
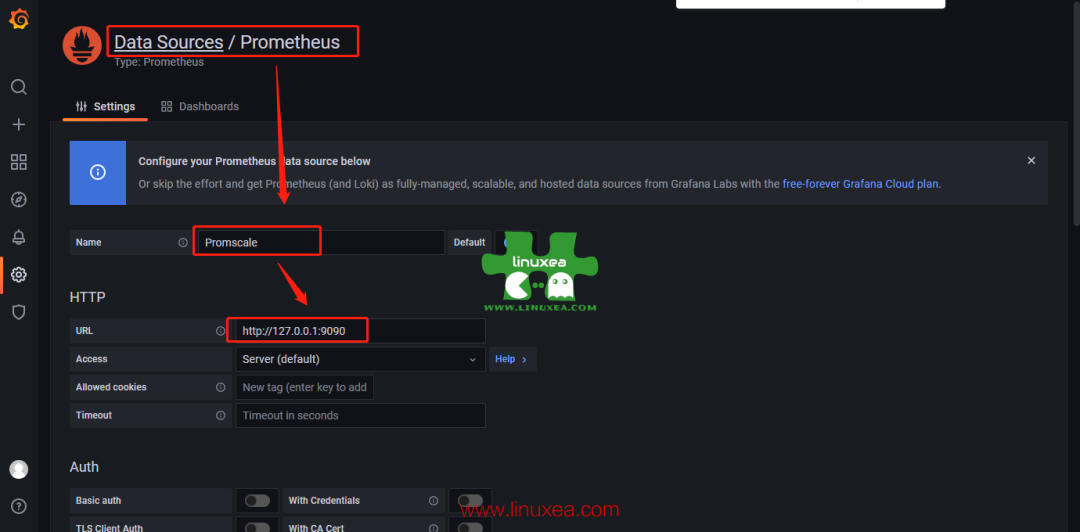
在这里下载一些模板https://grafana.com/grafana/dashboards/?pg=hp&plcmt=lt-box-dashboards&search=prometheus
Visualize data in Promscale[4]
prometheus
我们可以尝试配置远程, 配置参数可以查看官网[5]
remote_write:
  - url: "http://127.0.0.1:9201/write"
remote_read:
  - url: "http://127.0.0.1:9201/read"
    read_recent: true
远程配置如下
remote_write:
   - url: "http://127.0.0.1:9201/write"
     write_relabel_configs:
     - source_labels: [__name__]
       regex: '.*:.*'
       action: drop
     remote_timeout: 100s
     queue_config:
       capacity: 500000
       max_samples_per_send: 50000
       batch_send_deadline: 30s
       min_backoff: 100ms
       max_backoff: 10s
       min_shards: 16
       max_shards: 16
remote_read:
  - url: "http://127.0.0.1:9201/read"
    read_recent: true
prometheus.yaml 如下
global:
  scrape_interval:     15s
  evaluation_interval: 15s

alerting:
  alertmanagers:
  - scheme: http
    static_configs:
    - targets:
      - '127.0.0.1:9093'
rule_files:
  - "alert/host.alert.rules"
  - "alert/container.alert.rules"
  - "alert/targets.alert.rules"
scrape_configs:
  - job_name: prometheus
    scrape_interval: 30s
    static_configs:
    - targets: ['127.0.0.1:9090']
    - targets: ['127.0.0.1:9093']
    - targets: ['127.0.0.1:9100']
remote_write:
   - url: "http://127.0.0.1:9201/write"
     write_relabel_configs:
     - source_labels: [__name__]
       regex: '.*:.*'
       action: drop
     remote_timeout: 100s
     queue_config:
       capacity: 500000
       max_samples_per_send: 50000
       batch_send_deadline: 30s
       min_backoff: 100ms
       max_backoff: 10s
       min_shards: 16
       max_shards: 16
remote_read:
  - url: "http://127.0.0.1:9201/read"
    read_recent: true
重新启动后查看日志
ts=2022-03-03T01:35:28.123Z caller=main.go:1128 level=info msg="Loading configuration file" filename=/etc/prometheus/prometheus.yml
ts=2022-03-03T01:35:28.137Z caller=dedupe.go:112 component=remote level=info remote_name=797d34 url=http://127.0.0.1:9201/write msg="Starting WAL watcher" queue=797d34
ts=2022-03-03T01:35:28.138Z caller=dedupe.go:112 component=remote level=info remote_name=797d34 url=http://127.0.0.1:9201/write msg="Starting scraped metadata watcher"
ts=2022-03-03T01:35:28.277Z caller=dedupe.go:112 component=remote level=info remote_name=797d34 url=http://127.0.0.1:9201/write msg="Replaying WAL" queue=797d34
ts=2022-03-03T01:35:38.177Z caller=main.go:1165 level=info msg="Completed loading of configuration file" filename=/etc/prometheus/prometheus.yml totalDuration=10.053377011s db_storage=1.82µs remote_storage=13.752341ms web_handler=549ns query_engine=839ns scrape=10.038744417s scrape_sd=44.249µs notify=41.342µs notify_sd=6.871µs rules=30.465µs
ts=2022-03-03T01:35:38.177Z caller=main.go:896 level=info msg="Server is ready to receive web requests."
ts=2022-03-03T01:35:53.584Z caller=dedupe.go:112 component=remote level=info remote_name=797d34 url=http://127.0.0.1:9201/write msg="Done replaying WAL" duration=25.446317635s
查看数据
[root@localhost data]# docker exec -it timescaledb  sh
/ # su - postgres
timescaledb:~$ psql
psql (13.4)
Type "help" for help.

postgres=#
我们查询一个过去五分钟 io 的指标
查询指标
SELECT * from node_disk_io_now
WHERE time > now() - INTERVAL '5 minutes';
            time            | value | series_id |    labels     | device_id | instance_id | job_id
----------------------------+-------+-----------+---------------+-----------+-------------+--------
 2022-03-02 21:03:58.373-05 |     0 |       348 | {51,140,91,3} |       140 |          91 |      3
 2022-03-02 21:04:28.373-05 |     0 |       348 | {51,140,91,3} |       140 |          91 |      3
 2022-03-02 21:04:58.373-05 |     0 |       348 | {51,140,91,3} |       140 |          91 |      3
 2022-03-02 21:05:28.373-05 |     0 |       348 | {51,140,91,3} |       140 |          91 |      3
 2022-03-02 21:05:58.376-05 |     0 |       348 | {51,140,91,3} |       140 |          91 |      3
 2022-03-02 21:06:28.373-05 |     0 |       348 | {51,140,91,3} |       140 |          91 |      3
 2022-03-02 21:06:58.373-05 |     0 |       348 | {51,140,91,3} |       140 |          91 |      3
 2022-03-02 21:07:28.373-05 |     0 |       348 | {51,140,91,3} |       140 |          91 |      3
 2022-03-02 21:07:58.373-05 |     0 |       348 | {51,140,91,3} |       140 |          91 |      3
 2022-03-02 21:08:28.373-05 |     0 |       348 | {51,140,91,3} |       140 |          91 |      3
 2022-03-02 21:03:58.373-05 |     0 |       349 | {51,252,91,3} |       252 |          91 |      3
 2022-03-02 21:04:28.373-05 |     0 |       349 | {51,252,91,3} |       252 |          91 |      3
 2022-03-02 21:04:58.373-05 |     0 |       349 | {51,252,91,3} |       252 |          91 |      3
 2022-03-02 21:05:28.373-05 |     0 |       349 | {51,252,91,3} |       252 |          91 |      3
 2022-03-02 21:05:58.376-05 |     0 |       349 | {51,252,91,3} |       252 |          91 |      3
 2022-03-02 21:06:28.373-05 |     0 |       349 | {51,252,91,3} |       252 |          91 |      3
 2022-03-02 21:06:58.373-05 |     0 |       349 | {51,252,91,3} |       252 |          91 |      3
 2022-03-02 21:07:28.373-05 |     0 |       349 | {51,252,91,3} |       252 |          91 |      3
 2022-03-02 21:07:58.373-05 |     0 |       349 | {51,252,91,3} |       252 |          91 |      3
 2022-03-02 21:03:58.373-05 |     0 |       350 | {51,253,91,3} |       253 |          91 |      3
 2022-03-02 21:04:28.373-05 |     0 |       350 | {51,253,91,3} |       253 |          91 |      3
 2022-03-02 21:04:58.373-05 |     0 |       350 | {51,253,91,3} |       253 |          91 |      3
 2022-03-02 21:05:28.373-05 |     0 |       350 | {51,253,91,3} |       253 |          91 |      3
 2022-03-02 21:05:58.376-05 |     0 |       350 | {51,253,91,3} |       253 |          91 |      3
 2022-03-02 21:06:28.373-05 |     0 |       350 | {51,253,91,3} |       253 |          91 |      3
在进行一次聚合查询
标签键的查询值
每个标签键都扩展为自己的列,该列将外键标识符存储为其值。这允许JOIN按标签键和值进行聚合和过滤。
要检索由标签 ID 表示的文本,可以使用该val(field_id) 函数。这使你可以使用特定的标签键对所有系列进行聚合等操作。
例如,要查找指标的中值node_disk_io_now,按与其关联的工作分组:
SELECT
    val(job_id) as job,
    percentile_cont(0.5) within group (order by value) AS median
FROM
    node_disk_io_now
WHERE
    time > now() - INTERVAL '5 minutes'
GROUP BY job_id;
如下
postgres=# SELECT
postgres-#     val(job_id) as job,
postgres-#     percentile_cont(0.5) within group (order by value) AS median
postgres-# FROM
postgres-#     node_disk_io_now
postgres-# WHERE
postgres-#     time > now() - INTERVAL '5 minutes'
postgres-# GROUP BY job_id;
    job     | median
------------+--------
 prometheus |      0
(1 row)
查询指标的标签集
任何度量行中的labels字段表示与测量相关的完整标签集。它表示为标识符数组。要以 JSON 格式返回整个标签集,你可以使用该jsonb()函数,如下所示:
SELECT
    time, value, jsonb(labels) as labels
FROM
    node_disk_io_now
WHERE
    time > now() - INTERVAL '5 minutes';
如下
time            | value |                                                labels
----------------------------+-------+-------------------------------------------------------------------------------------------------------
 2022-03-02 21:09:58.373-05 |     0 | {"job": "prometheus", "device": "dm-0", "__name__": "node_disk_io_now", "instance": "127.0.0.1:9100"}
 2022-03-02 21:10:28.373-05 |     0 | {"job": "prometheus", "device": "dm-0", "__name__": "node_disk_io_now", "instance": "127.0.0.1:9100"}
 2022-03-02 21:10:58.373-05 |     0 | {"job": "prometheus", "device": "dm-0", "__name__": "node_disk_io_now", "instance": "127.0.0.1:9100"}
 2022-03-02 21:11:28.373-05 |     0 | {"job": "prometheus", "device": "dm-0", "__name__": "node_disk_io_now", "instance": "127.0.0.1:9100"}
 2022-03-02 21:11:58.373-05 |     0 | {"job": "prometheus", "device": "dm-0", "__name__": "node_disk_io_now", "instance": "127.0.0.1:9100"}
 2022-03-02 21:12:28.373-05 |     0 | {"job": "prometheus", "device": "dm-0", "__name__": "node_disk_io_now", "instance": "127.0.0.1:9100"}
 2022-03-02 21:12:58.373-05 |     0 | {"job": "prometheus", "device": "dm-0", "__name__": "node_disk_io_now", "instance": "127.0.0.1:9100"}
 2022-03-02 21:13:28.373-05 |     0 | {"job": "prometheus", "device": "dm-0", "__name__": "node_disk_io_now", "instance": "127.0.0.1:9100"}
 2022-03-02 21:13:58.373-05 |     0 | {"job": "prometheus", "device": "dm-0", "__name__": "node_disk_io_now", "instance": "127.0.0.1:9100"}
 2022-03-02 21:14:28.373-05 |     0 | {"job": "prometheus", "device": "dm-0", "__name__": "node_disk_io_now", "instance": "127.0.0.1:9100"}
 2022-03-02 21:09:58.373-05 |     0 | {"job": "prometheus", "device": "dm-1", "__name__": "node_disk_io_now", "instance": "127.0.0.1:9100"}
 2022-03-02 21:10:28.373-05 |     0 | {"job": "prometheus", "device": "dm-1", "__name__": "node_disk_io_now", "instance": "127.0.0.1:9100"}
 2022-03-02 21:10:58.373-05 |     0 | {"job": "prometheus", "device": "dm-1", "__name__": "node_disk_io_now", "instance": "127.0.0.1:9100"}
 2022-03-02 21:11:28.373-05 |     0 | {"job": "prometheus", "device": "dm-1", "__name__": "node_disk_io_now", "instance": "127.0.0.1:9100"}
 2022-03-02 21:11:58.373-05 |     0 | {"job": "prometheus", "device": "dm-1", "__name__": "node_disk_io_now", "instance": "127.0.0.1:9100"}
 2022-03-02 21:12:28.373-05 |     0 | {"job": "prometheus", "device": "dm-1", "__name__": "node_disk_io_now", "instance": "127.0.0.1:9100"}
 2022-03-02 21:12:58.373-05 |     0 | {"job": "prometheus", "device": "dm-1", "__name__": "node_disk_io_now", "instance": "127.0.0.1:9100"}
 2022-03-02 21:13:28.373-05 |     0 | {"job": "prometheus", "device": "dm-1", "__name__": "node_disk_io_now", "instance": "127.0.0.1:9100"}
 2022-03-02 21:13:58.373-05 |     0 | {"job": "prometheus", "device": "dm-1", "__name__": "node_disk_io_now", "instance": "127.0.0.1:9100"}
 2022-03-02 21:09:58.373-05 |     0 | {"job": "prometheus", "device": "sda", "__name__": "node_disk_io_now", "instance": "127.0.0.1:9100"}
 2022-03-02 21:10:28.373-05 |     0 | {"job": "prometheus", "device": "sda", "__name__": "node_disk_io_now", "instance": "127.0.0.1:9100"}
 2022-03-02 21:10:58.373-05 |     0 | {"job": "prometheus", "device": "sda", "__name__": "node_disk_io_now", "instance": "127.0.0.1:9100"}
 2022-03-02 21:11:28.373-05 |     0 | {"job": "prometheus", "device": "sda", "__name__": "node_disk_io_now", "instance": "127.0.0.1:9100"}
 2022-03-02 21:11:58.373-05 |     0 | {"job": "prometheus", "device": "sda", "__name__": "node_disk_io_now", "instance": "127.0.0.1:9100"}
 2022-03-02 21:12:28.373-05 |     0 | {"job": "prometheus", "device": "sda", "__name__": "node_disk_io_now", "instance": "127.0.0.1:9100"}
查询 node_disk_info
postgres=# SELECT * FROM prom_series.node_disk_info;
 series_id |         labels         | device |    instance    |    job     | major | minor
-----------+------------------------+--------+----------------+------------+-------+-------
       250 | {150,140,91,3,324,325} | dm-0   | 127.0.0.1:9100 | prometheus | 253   | 0
       439 | {150,253,91,3,508,325} | sda    | 127.0.0.1:9100 | prometheus | 8     | 0
       440 | {150,258,91,3,507,325} | sr0    | 127.0.0.1:9100 | prometheus | 11    | 0
       516 | {150,252,91,3,324,564} | dm-1   | 127.0.0.1:9100 | prometheus | 253   | 1
(4 rows)
带标签查询
SELECT
  jsonb(labels) as labels,
  value
FROM node_disk_info
WHERE time < now();
Results:
labels                                                               | value
-----------------------------------------------------------------------------------------------------------------------------------+-------
 {"job": "prometheus", "major": "253", "minor": "0", "device": "dm-0", "__name__": "node_disk_info", "instance": "127.0.0.1:9100"} |     1
 {"job": "prometheus", "major": "253", "minor": "0", "device": "dm-0", "__name__": "node_disk_info", "instance": "127.0.0.1:9100"} |     1
 {"job": "prometheus", "major": "253", "minor": "0", "device": "dm-0", "__name__": "node_disk_info", "instance": "127.0.0.1:9100"} |     1
 {"job": "prometheus", "major": "253", "minor": "0", "device": "dm-0", "__name__": "node_disk_info", "instance": "127.0.0.1:9100"} |     1
 {"job": "prometheus", "major": "253", "minor": "0", "device": "dm-0", "__name__": "node_disk_info", "instance": "127.0.0.1:9100"} |     1
 {"job": "prometheus", "major": "253", "minor": "0", "device": "dm-0", "__name__": "node_disk_info", "instance": "127.0.0.1:9100"} |     1
 {"job": "prometheus", "major": "253", "minor": "0", "device": "dm-0", "__name__": "node_disk_info", "instance": "127.0.0.1:9100"} |     1
 {"job": "prometheus", "major": "253", "minor": "0", "device": "dm-0", "__name__": "node_disk_info", "instance": "127.0.0.1:9100"} |     1
 {"job": "prometheus", "major": "253", "minor": "0", "device": "dm-0", "__name__": "node_disk_info", "instance": "127.0.0.1:9100"} |     1
 {"job": "prometheus", "major": "253", "minor": "0", "device": "dm-0", "__name__": "node_disk_info", "instance": "127.0.0.1:9100"} |   NaN
 {"job": "prometheus", "major": "253", "minor": "0", "device": "dm-0", "__name__": "node_disk_info", "instance": "127.0.0.1:9100"} |     1
 {"job": "prometheus", "major": "253", "minor": "0", "device": "dm-0", "__name__": "node_disk_info", "instance": "127.0.0.1:9100"} |     1
 {"job": "prometheus", "major": "253", "minor": "0", "device": "dm-0", "__name__": "node_disk_info", "instance": "127.0.0.1:9100"} |     1
 {"job": "prometheus", "major": "253", "minor": "0", "device": "dm-0", "__name__": "node_disk_info", "instance": "127.0.0.1:9100"} |     1
 {"job": "prometheus", "major": "253", "minor": "0", "device": "dm-0", "__name__": "node_disk_info", "instance": "127.0.0.1:9100"} |     1
 {"job": "prometheus", "major": "253", "minor": "0", "device": "dm-0", "__name__": "node_disk_info", "instance": "127.0.0.1:9100"} |     1
 {"job": "prometheus", "major": "253", "minor": "0", "device": "dm-0", "__name__": "node_disk_info", "instance": "127.0.0.1:9100"} |     1
 {"job": "prometheus", "major": "253", "minor": "0", "device": "dm-0", "__name__": "node_disk_info", "instance": "127.0.0.1:9100"} |     1
 {"job": "prometheus", "major": "253", "minor": "0", "device": "dm-0", "__name__": "node_disk_info", "instance": "127.0.0.1:9100"} |     1
 {"job": "prometheus", "major": "253", "minor": "0", "device": "dm-0", "__name__": "node_disk_info", "instance": "127.0.0.1:9100"} |     1
 {"job": "prometheus", "major": "253", "minor": "0", "device": "dm-0", "__name__": "node_disk_info", "instance": "127.0.0.1:9100"} |     1
 {"job": "prometheus", "major": "253", "minor": "0", "device": "dm-0", "__name__": "node_disk_info", "instance": "127.0.0.1:9100"} |     1
 {"job": "prometheus", "major": "253", "minor": "0", "device": "dm-0", "__name__": "node_disk_info", "instance": "127.0.0.1:9100"} |     1
 {"job": "prometheus", "major": "253", "minor": "0", "device": "dm-0", "__name__": "node_disk_info", "instance": "127.0.0.1:9100"} |     1
 {"job": "prometheus", "major": "253", "minor": "0", "device": "dm-0", "__name__": "node_disk_info", "instance": "127.0.0.1:9100"} |     1
通过命令进行查看她的指标视图
postgres=# \d+ node_disk_info
                                View "prom_metric.node_disk_info"
   Column    |           Type           | Collation | Nullable | Default | Storage  | Description
-------------+--------------------------+-----------+----------+---------+----------+-------------
 time        | timestamp with time zone |           |          |         | plain    |
 value       | double precision         |           |          |         | plain    |
 series_id   | bigint                   |           |          |         | plain    |
 labels      | label_array              |           |          |         | extended |
 device_id   | integer                  |           |          |         | plain    |
 instance_id | integer                  |           |          |         | plain    |
 job_id      | integer                  |           |          |         | plain    |
 major_id    | integer                  |           |          |         | plain    |
 minor_id    | integer                  |           |          |         | plain    |
View definition:
 SELECT data."time",
    data.value,
    data.series_id,
    series.labels,
    series.labels[2] AS device_id,
    series.labels[3] AS instance_id,
    series.labels[4] AS job_id,
    series.labels[5] AS major_id,
    series.labels[6] AS minor_id
   FROM prom_data.node_disk_info data
LEFT JOIN prom_data_series.node_disk_info series ON series.id = data.series_id;更多的查询,可以查看官网的教程[6]
计划删除
promscale 里是 pg 里配删除计划的是 90 天删除
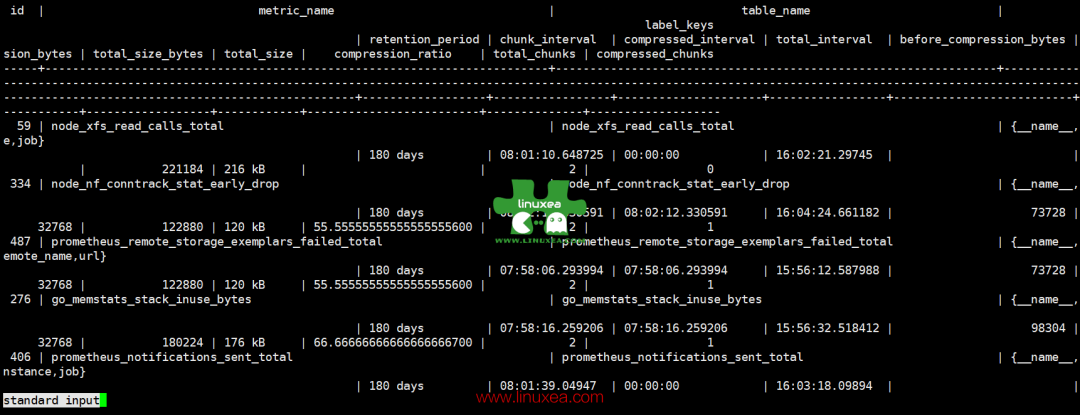
通过SELECT * FROM prom_info.metric;查看
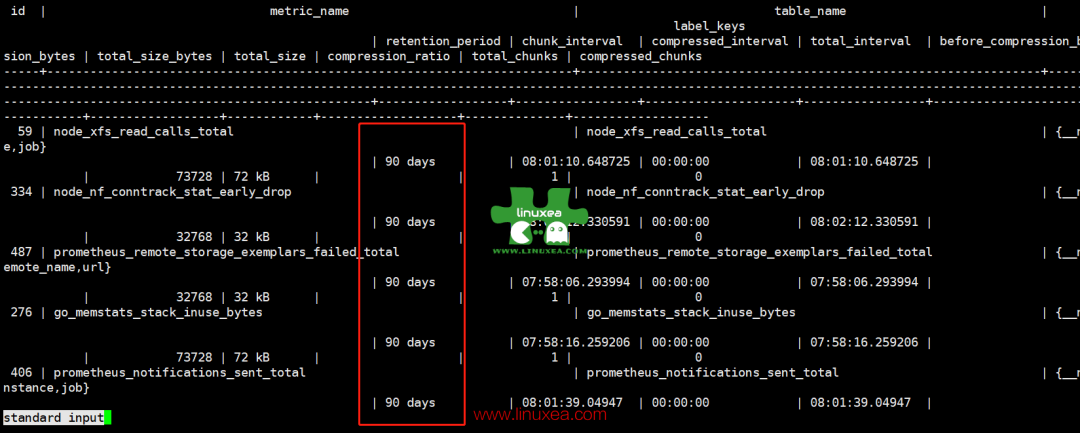
我们可以通过调整来修改
TimescaleDB 包括一个后台作业调度框架,用于自动化数据管理任务,例如启用简单的数据保留策略。
为了添加这样的数据保留策略,数据库管理员可以创建、删除或更改导致drop_chunks根据某个定义的计划自动执行的策略。
要在超表上添加这样的策略,不断导致超过 24 小时的块被删除,只需执行以下命令:
SELECT add_retention_policy('conditions', INTERVAL '24 hours');随后删除该策略:
SELECT remove_retention_policy('conditions');调度程序框架还允许查看已调度的作业:
SELECT * FROM timescaledb_information.job_stats;创建数据保留策略以丢弃超过 6 个月的数据块:
SELECT add_retention_policy('conditions', INTERVAL '6 months');复制
使用基于整数的时间列创建数据保留策略:
SELECT add_retention_policy('conditions', BIGINT '600000');我们可以调整 prometheus 的数据,参考Data Retention[7]
SELECT
set_default_retention_period(180 * INTERVAL '1 day')
如下
postgres=# SELECT
postgres-# set_default_retention_period(180 * INTERVAL '1 day');
 set_default_retention_period
------------------------------
 t
(1 row)
已经修改为 180 天
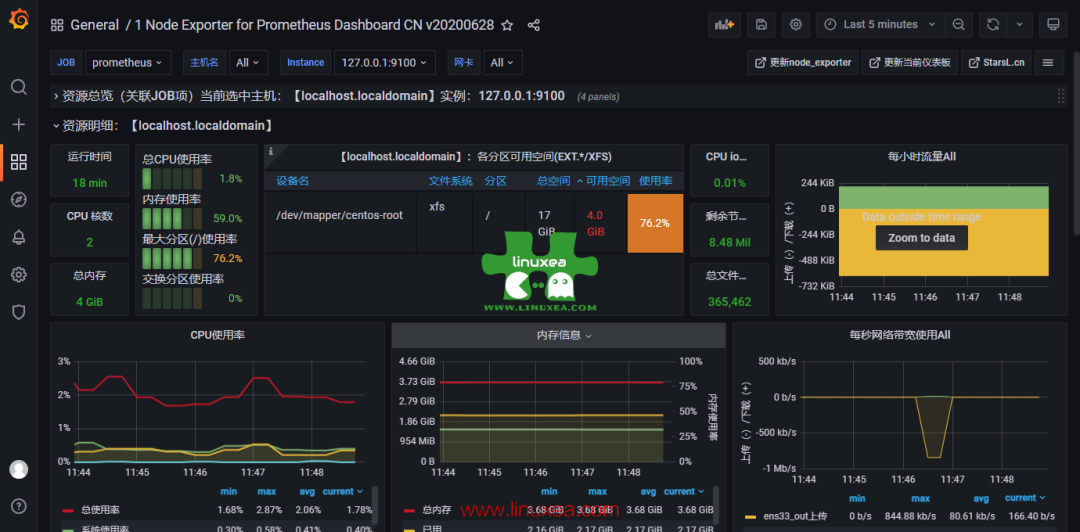
我们打开 prometheus 和 grafana 都可以正常的查看
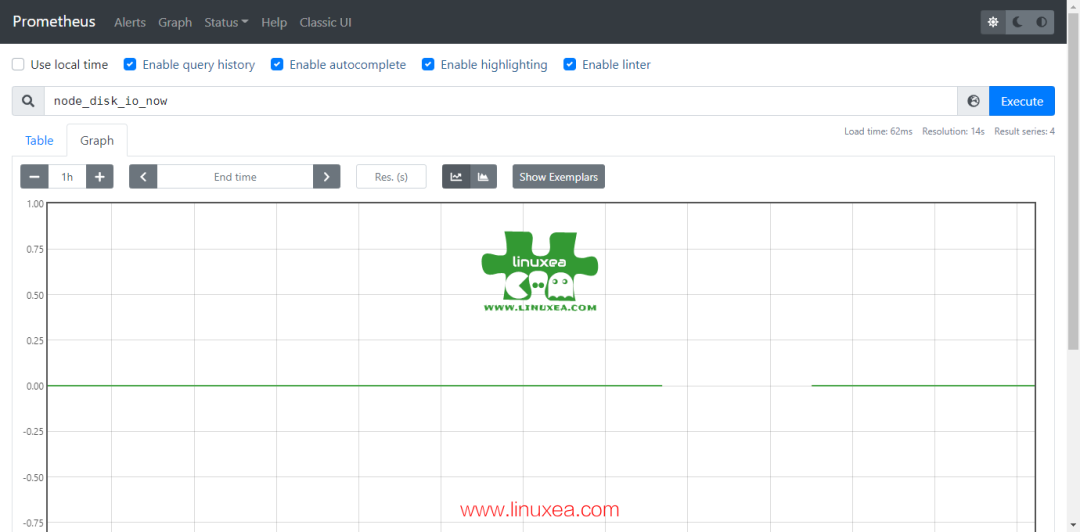
grafana
关于当前版本的压测
在 slack 上,有一个朋友做了压测:
Hello everyone, I am doing a promscale+timescaledb performance test with 1 promscale(8cpu 32GB memory), 1 timescaledb(postgre12.9+timescale2.5.2 with 16cpu 32G mem), 1 prometheus(8cpu 32G mem), simulate 2500 node_exporters( 1000 metrics/min * 2500 = 2.5 million metrics/min ) . But it seams not stable,
做一个 promscale+timescaledb 性能测试,1 个 promscale(8cpu 32GB 内存),1 个 timescaledb(postgre12.9+timescale2.5.2 with 16cpu 32G mem),1 个 prometheus(8cpu 32G mem),模拟 2500 个 node_exporters(1000 指标/分钟 * 2500 = 250 万指标/分钟)。但它的接缝不稳定,异常如下
there are warninigs in prometheus:
level=info ts=2022-03-01T12:36:33.365Z caller=throughput.go:76 msg="ingestor throughput" samples/sec=35000 metrics-max-sent-ts=2022-03-01T11:21:48.129Z
level=info ts=2022-03-01T12:36:34.365Z caller=throughput.go:76 msg="ingestor throughput" samples/sec=35000 metrics-max-sent-ts=2022-03-01T11:21:48.129Z
level=warn ts=2022-03-01T12:36:34.482Z caller=watcher.go:101 msg="[WARNING] Ingestion is a very long time" duration=5m9.705407837s threshold=1m0s
level=info ts=2022-03-01T12:36:35.365Z caller=throughput.go:76 msg="ingestor throughput" samples/sec=35000 metrics-max-sent-ts=2022-03-01T11:21:48.129Z
level=info ts=2022-03-01T12:36:40.365Z caller=throughput.go:76 msg="ingestor throughput" samples/sec=70000 metrics-max-sent-ts=2022-03-01T11:21:48.129Z
and errors in prometheus:
Mar 01 20:38:55 localhost start-prometheus.sh[887]: ts=2022-03-01T12:38:55.288Z caller=dedupe.go:112 component=remote level=warn remote_name=ceec38 url=http://192.168.105.76:9201/write msg="Failed to send batch, retrying" err="Post \"http://192.168.105.76:9201/write\": context deadline exceeded"
any way to increase the thoughput at current configuration?
他们推荐使用
remote_write:
    - url: "http://promscale:9201/write"
      write_relabel_configs:
      - source_labels: [__name__]
        regex: '.*:.*'
        action: drop
      remote_timeout: 100s
      queue_config:
        capacity: 500000
        max_samples_per_send: 50000
        batch_send_deadline: 30s
        min_backoff: 100ms
        max_backoff: 10s
        min_shards: 16
        max_shards: 16
随后将配置 pg 更改为 14.2 和 remote_write 设置,将 promscale mem 增加到 32G,仍然不稳定。
请注意,这是 2500 台的节点压测,那么,这个朋友的测试可以看到至少在目前看来,promscale 的开发版本仍然是处于一个初期。官方并没有进行可靠性压测 .我们期待未来的稳定版本
引用链接
[1]
100% 兼容 PromQL: https://promlabs.com/promql-compliance-test-results/2021-10-14/promscale
[2]Grafana: https://grafana.com/
[3]PromLens: https://promlens.com/
[4]Visualize data in Promscale: https://docs.timescale.com/promscale/latest/visualize-data/#connect-promscale-and-grafana
[5]官网: https://docs.timescale.com/promscale/latest/send-data/prometheus/#configure-prometheus-for-better-performance-with-promscale
[6]官网的教程: https://docs.timescale.com/promscale/latest/query-data/#query-metric-data-with-sql
[7]Data Retention: https://github.com/timescale/promscale/blob/4330f6ce02dd2f9c1f66b23cc8e2fe6de428661c/docs/sql_schema.md#data-retention
原文链接:https://www.linuxea.com/2634.html


你可能还喜欢
点击下方图片即可阅读


云原生是一种信仰 🤘
关注公众号
后台回复◉k8s◉获取史上最方便快捷的 Kubernetes 高可用部署工具,只需一条命令,连 ssh 都不需要!


点击 "阅读原文" 获取更好的阅读体验!
发现朋友圈变“安静”了吗?